Time on ice, new graphics, and xG!
Upgraded statistics coming in 2023/24

We're super excited to tell you about a whole new package of statistics coming live for every Elite League game this season that we've been working on behind the scenes for the past 18 months!
Beginning this Friday, we'll have live time on ice from every game, updated statistics visualisations, and we're also among only a handful of leagues in Europe to introduce xG into our game night experience.
You can check out how all of the new features look by going back to the 2023 Playoff Final.
"A huge amount of effort, time and resource has gone into our off-season statistics upgrades, probably the biggest we've ever done in the Elite League," began Head of Hockey Operations, Mike Hicks. "We're very grateful to Belfast for helping us collect time on ice in the Cup Final as a trial, and to the off-ice team from Coventry who gave us the additional help at the Playoff Finals Weekend for the second phase of testing. Finally, a huge thank you to each of the off-ice crews at each of the ten teams for their work during the summer in expending their numbers, their diligence during pre-season and their positivity to taking what we do up another level.
"What we're now able to provide in-game is invaluable. We know that fans love to see as much detail about each game as possible, but for the first time in the EIHL we're now able to offer our coaches more in-play data than ever before. Now they don't need to wait until a few hours after the game to see time on ice, but can get it in real-time on the bench or in the locker room. We've had a good pre-season of testing, and while there, of course, may be teething problems as we go into competitive games, we're very excited to launch these upgrades."
Time on ice
Trialled at the Challenge Cup and Playoff Finals Weekend in 2023, live in-play time on ice data tells you exactly how many minutes each player is logging in each game. On player statistics, you'll also see an average ice time per game, detailing who the iron men are logging big minutes every night.
xG
xG, or 'expected goals', is a metric designed to measure the probability of a shot resulting in a goal. An xG model uses historical information from thousands of shots across hundreds of Elite League games to estimate the likelihood of a goal on a scale between 0 and 1. For example, a shot with an xG value of 0.2 is one that we would generally expect to be converted twice in every 10 attempts. Shots are broken down into low, medium and high danger areas, but there's a lot more to the model than that.
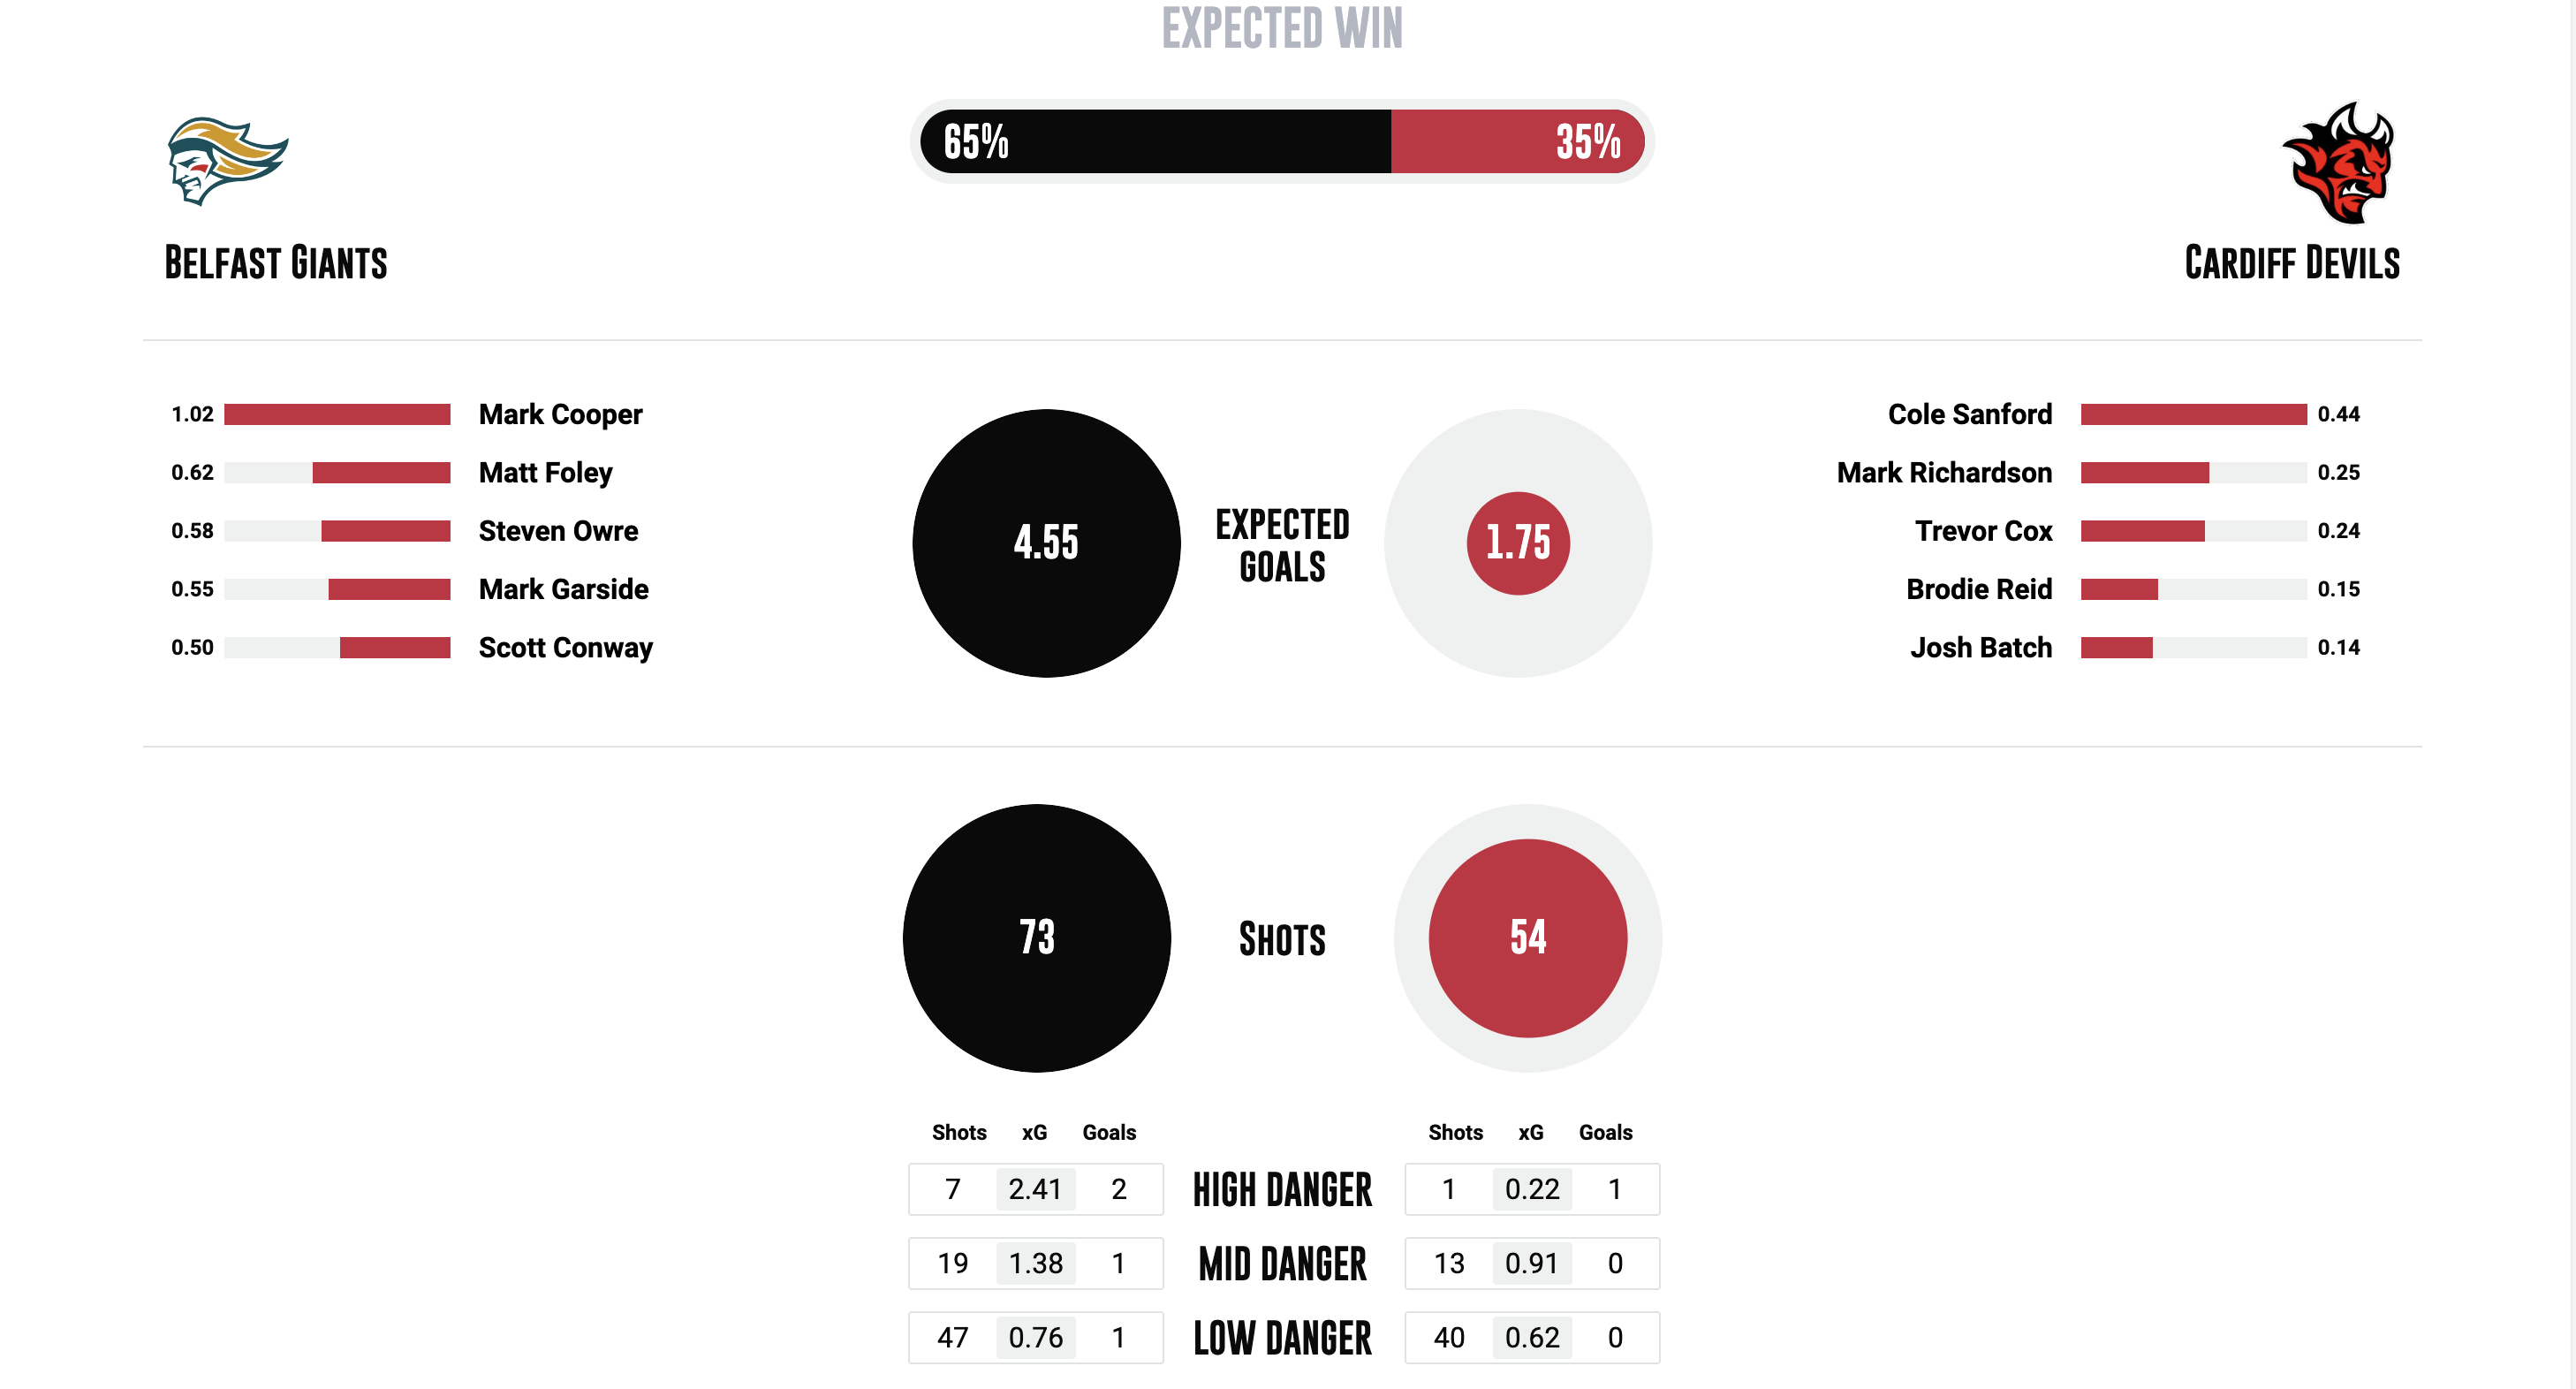
Each Elite League game will come with an expect goals per team, leading to an expected win calculation. The Expected Win statistic (xW) estimates the probability of winning for each team given the chances they create and concede in the game measured by Expected Goals (xG) and given time elapsed. Expected Win is calculated based on hundreds of hockey games and can be interpreted as the average win rate by teams with a similar xG result in the past (e.g. Expected Win of 60% means that teams with similar Expected Goals created and conceded in the same moment in a game won approximately 60% of those games).
This will be an evolving process - there are a lot of players who haven't played in the EIHL before, so their xG data will take a few games to develop and in turn filter into their team's Expected Win calculation.
Updated statistics visualisations
Our online Gamecentre will now come with four visualisations to tell the story of each game:
- NEW Expected Goals Story: All shots from the game and their xG are visualised in the Expected Goals Story – the chart shows all shots (dots), goals (team logos) and Expected Goals (height of the line) in the game with period splits of xG underneath the chart. Game moments in which one team is dominating can be identified by a steep rise of the xG line. On the other hand, a flat line indicates the moments in a game in which the team was unable to generate scoring chances.
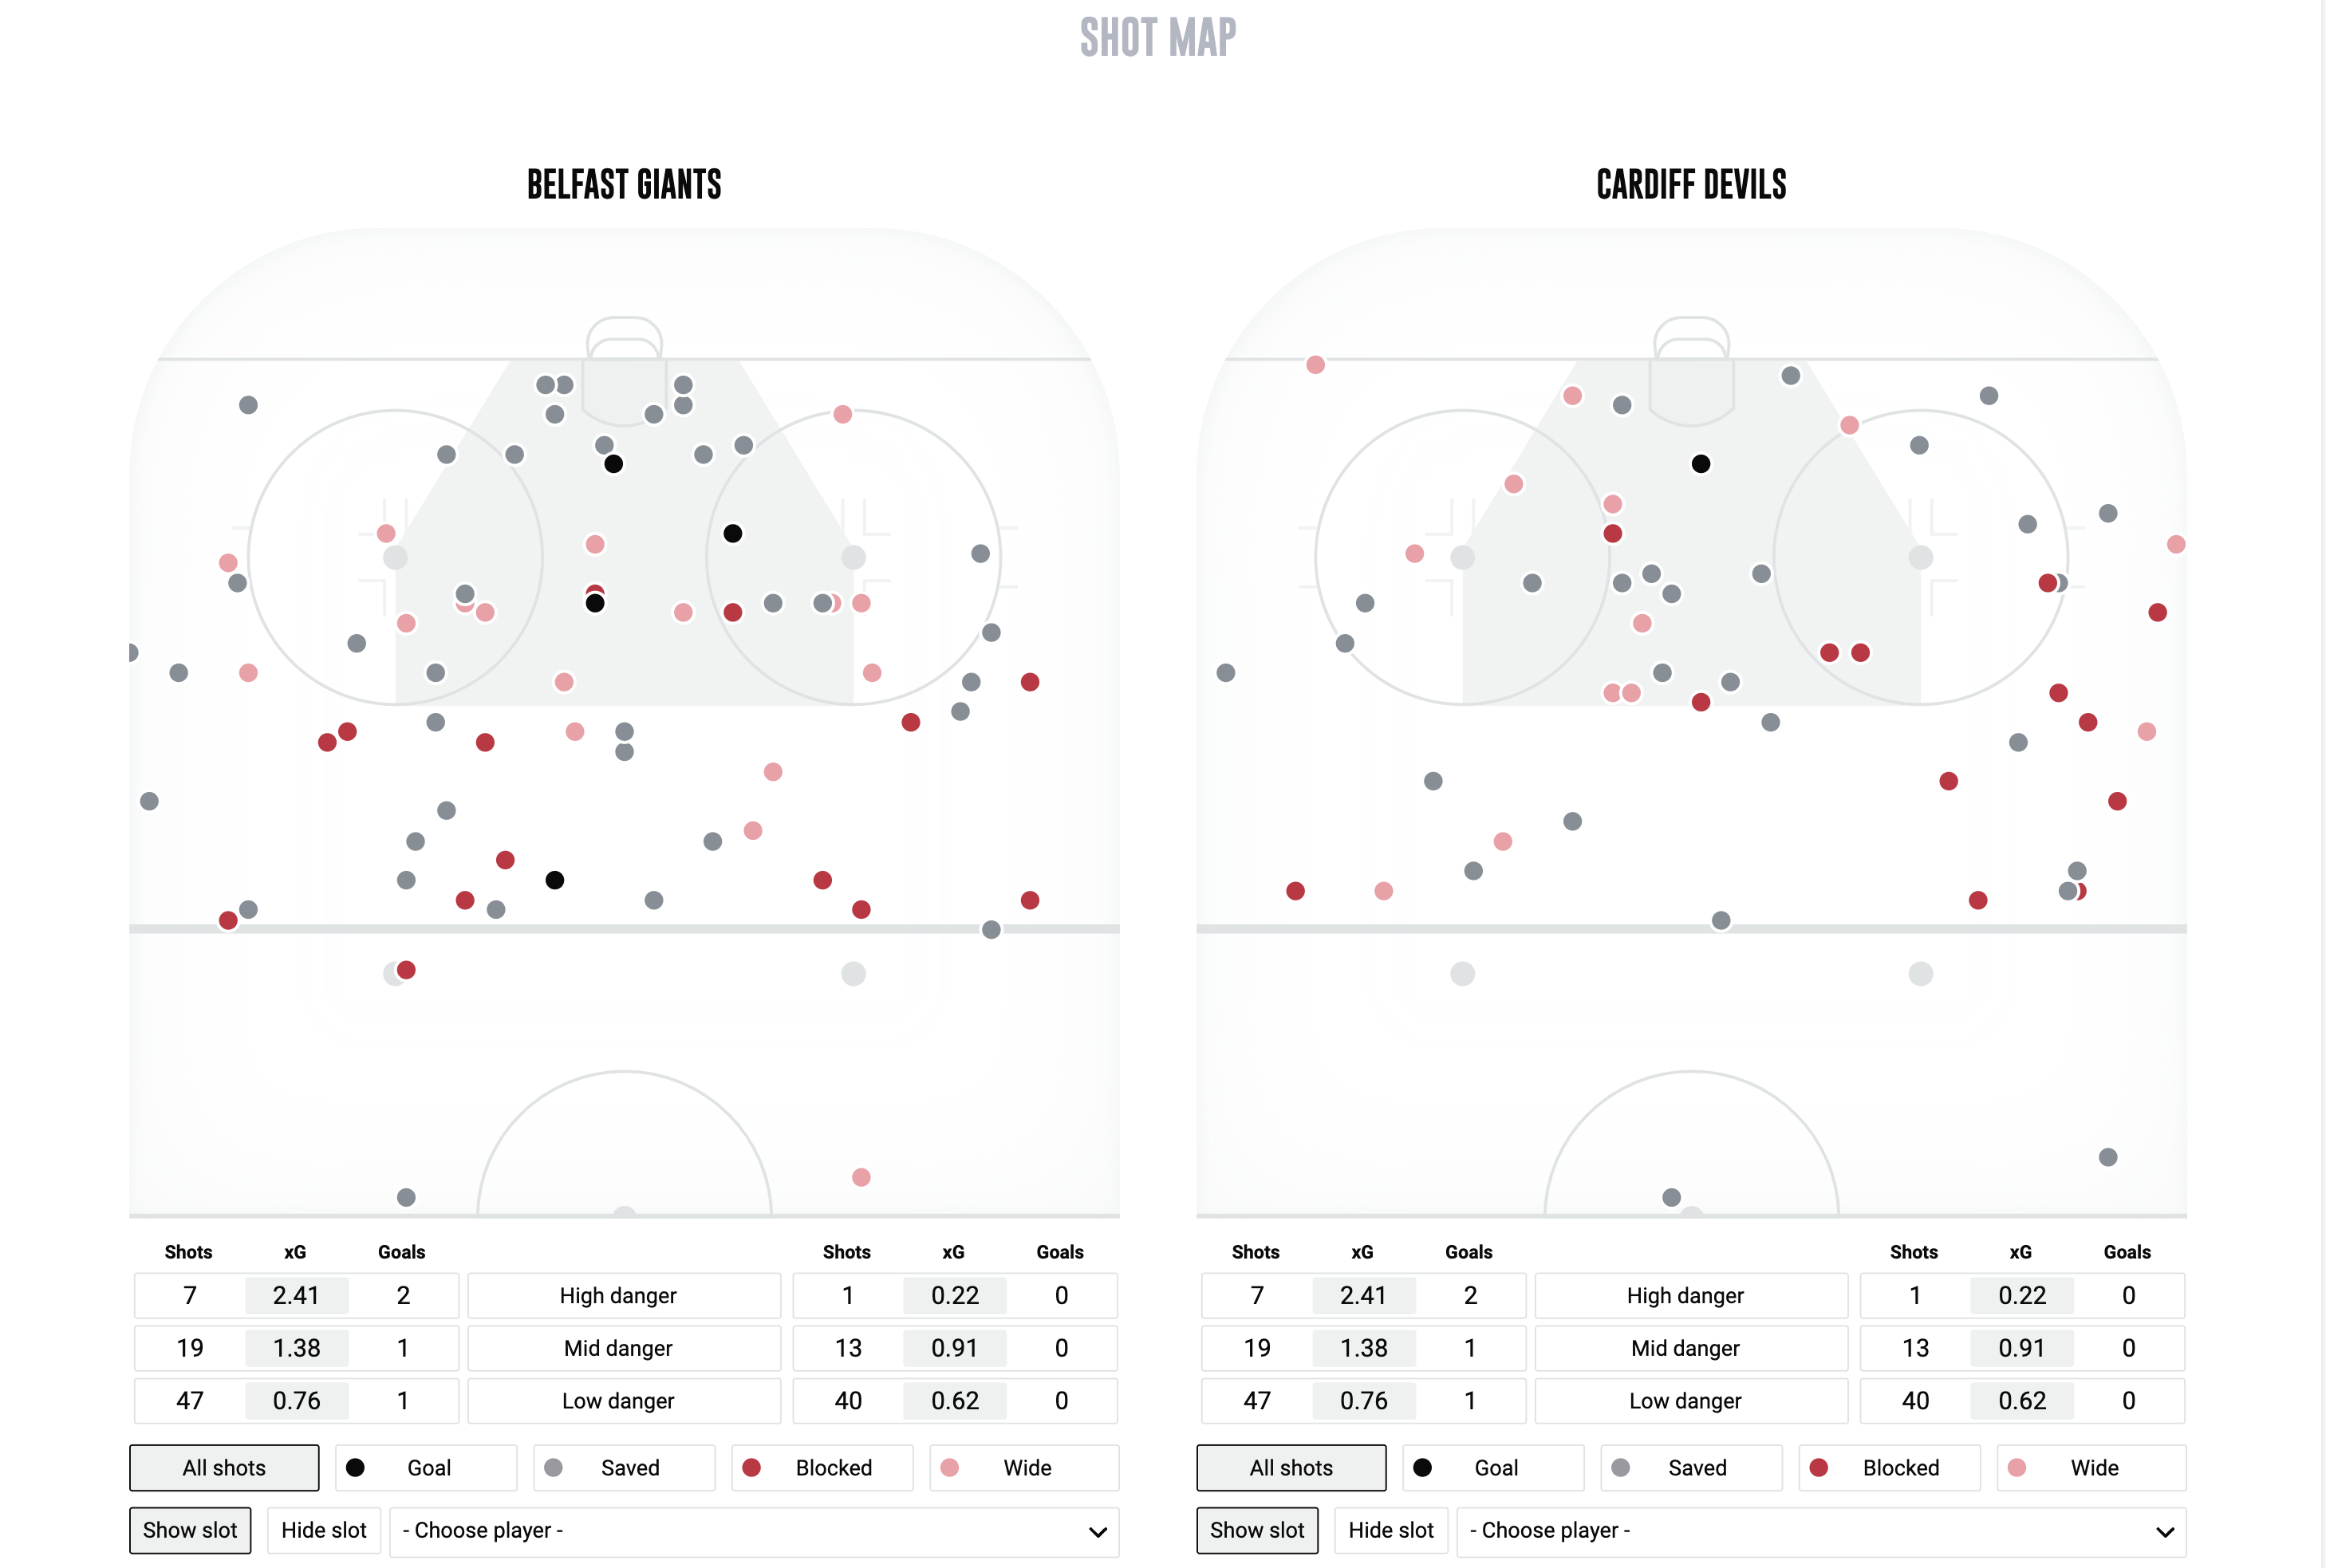
- Updated Shot Map: All shots from the game are visualised on the Shot Map based on their location on the ice. There are two maps, one for each team, displaying all shots attempted by a team. The highlighted grey area in front of the net is called the “slot”. Shots from the slot are statistically the most dangerous. There are goals (black dots), saved shots (grey), shots blocked (red) and shots wide (pink). Using the buttons below the shot map, you can filter shots by player or by high, mid and low danger.
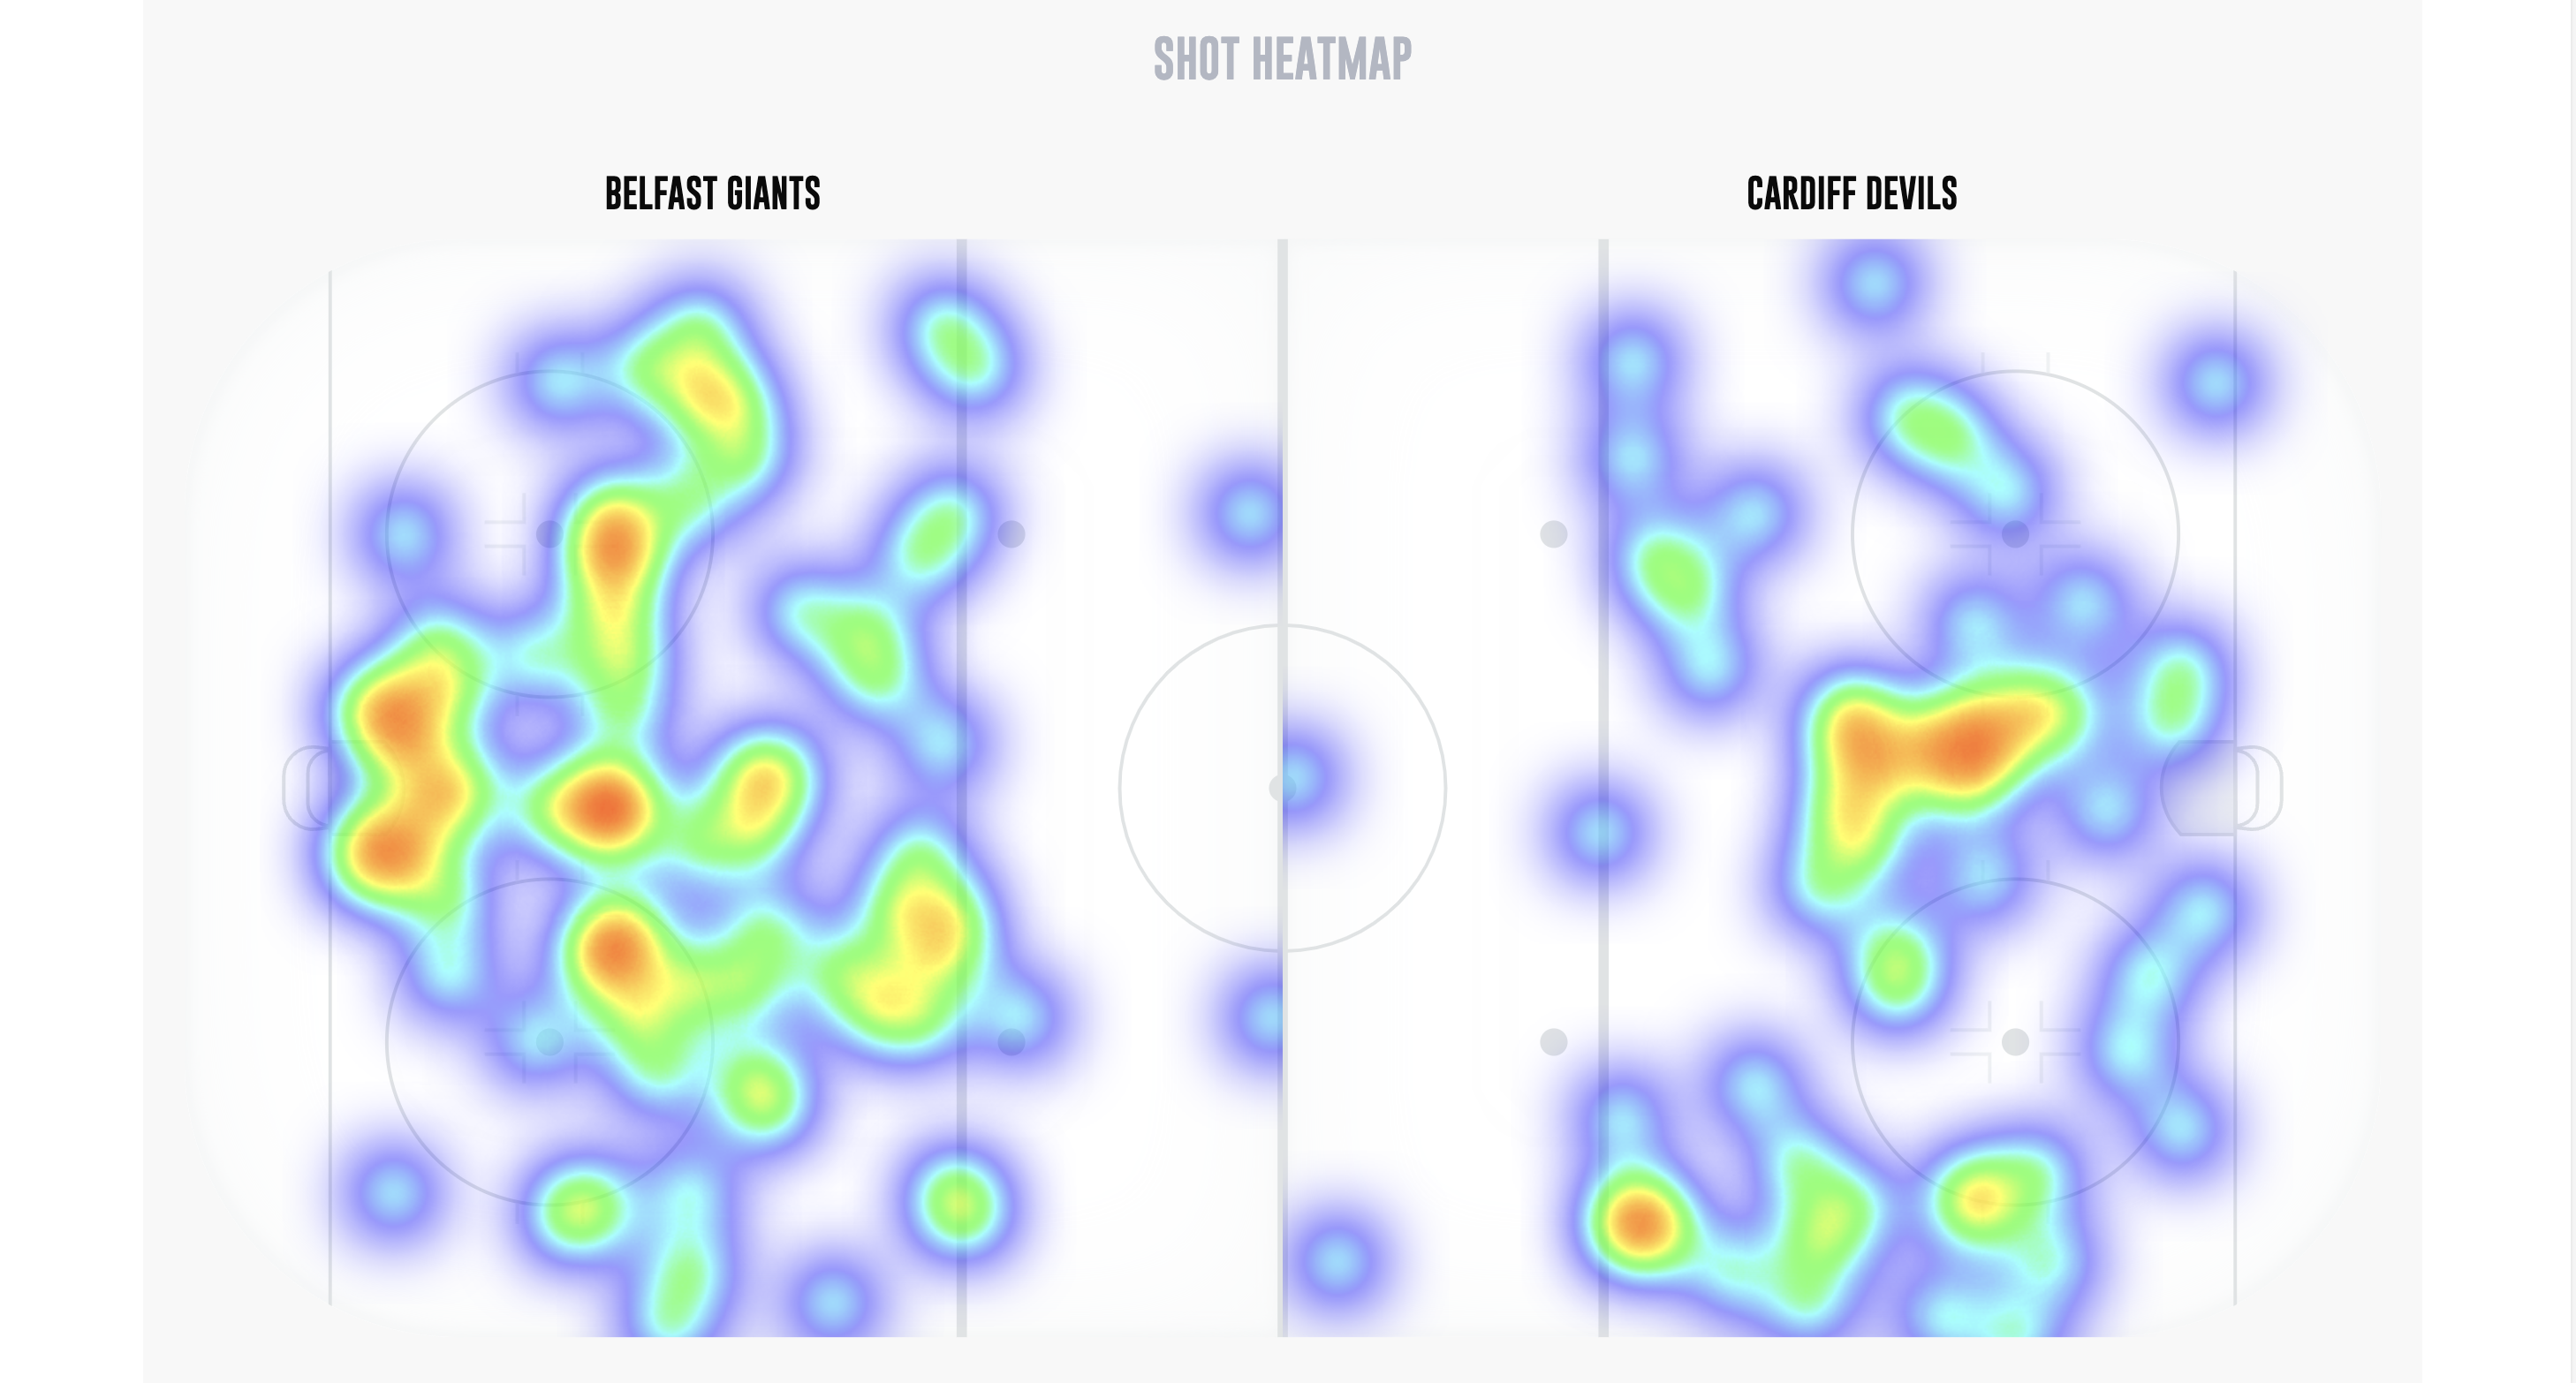
- NEW Shots Heatmap: The heatmap shows locations on the ice where teams took shots. Places on the ice where the colour is red (or close to red) indicate areas where the team was most active and generated most shot attempts.
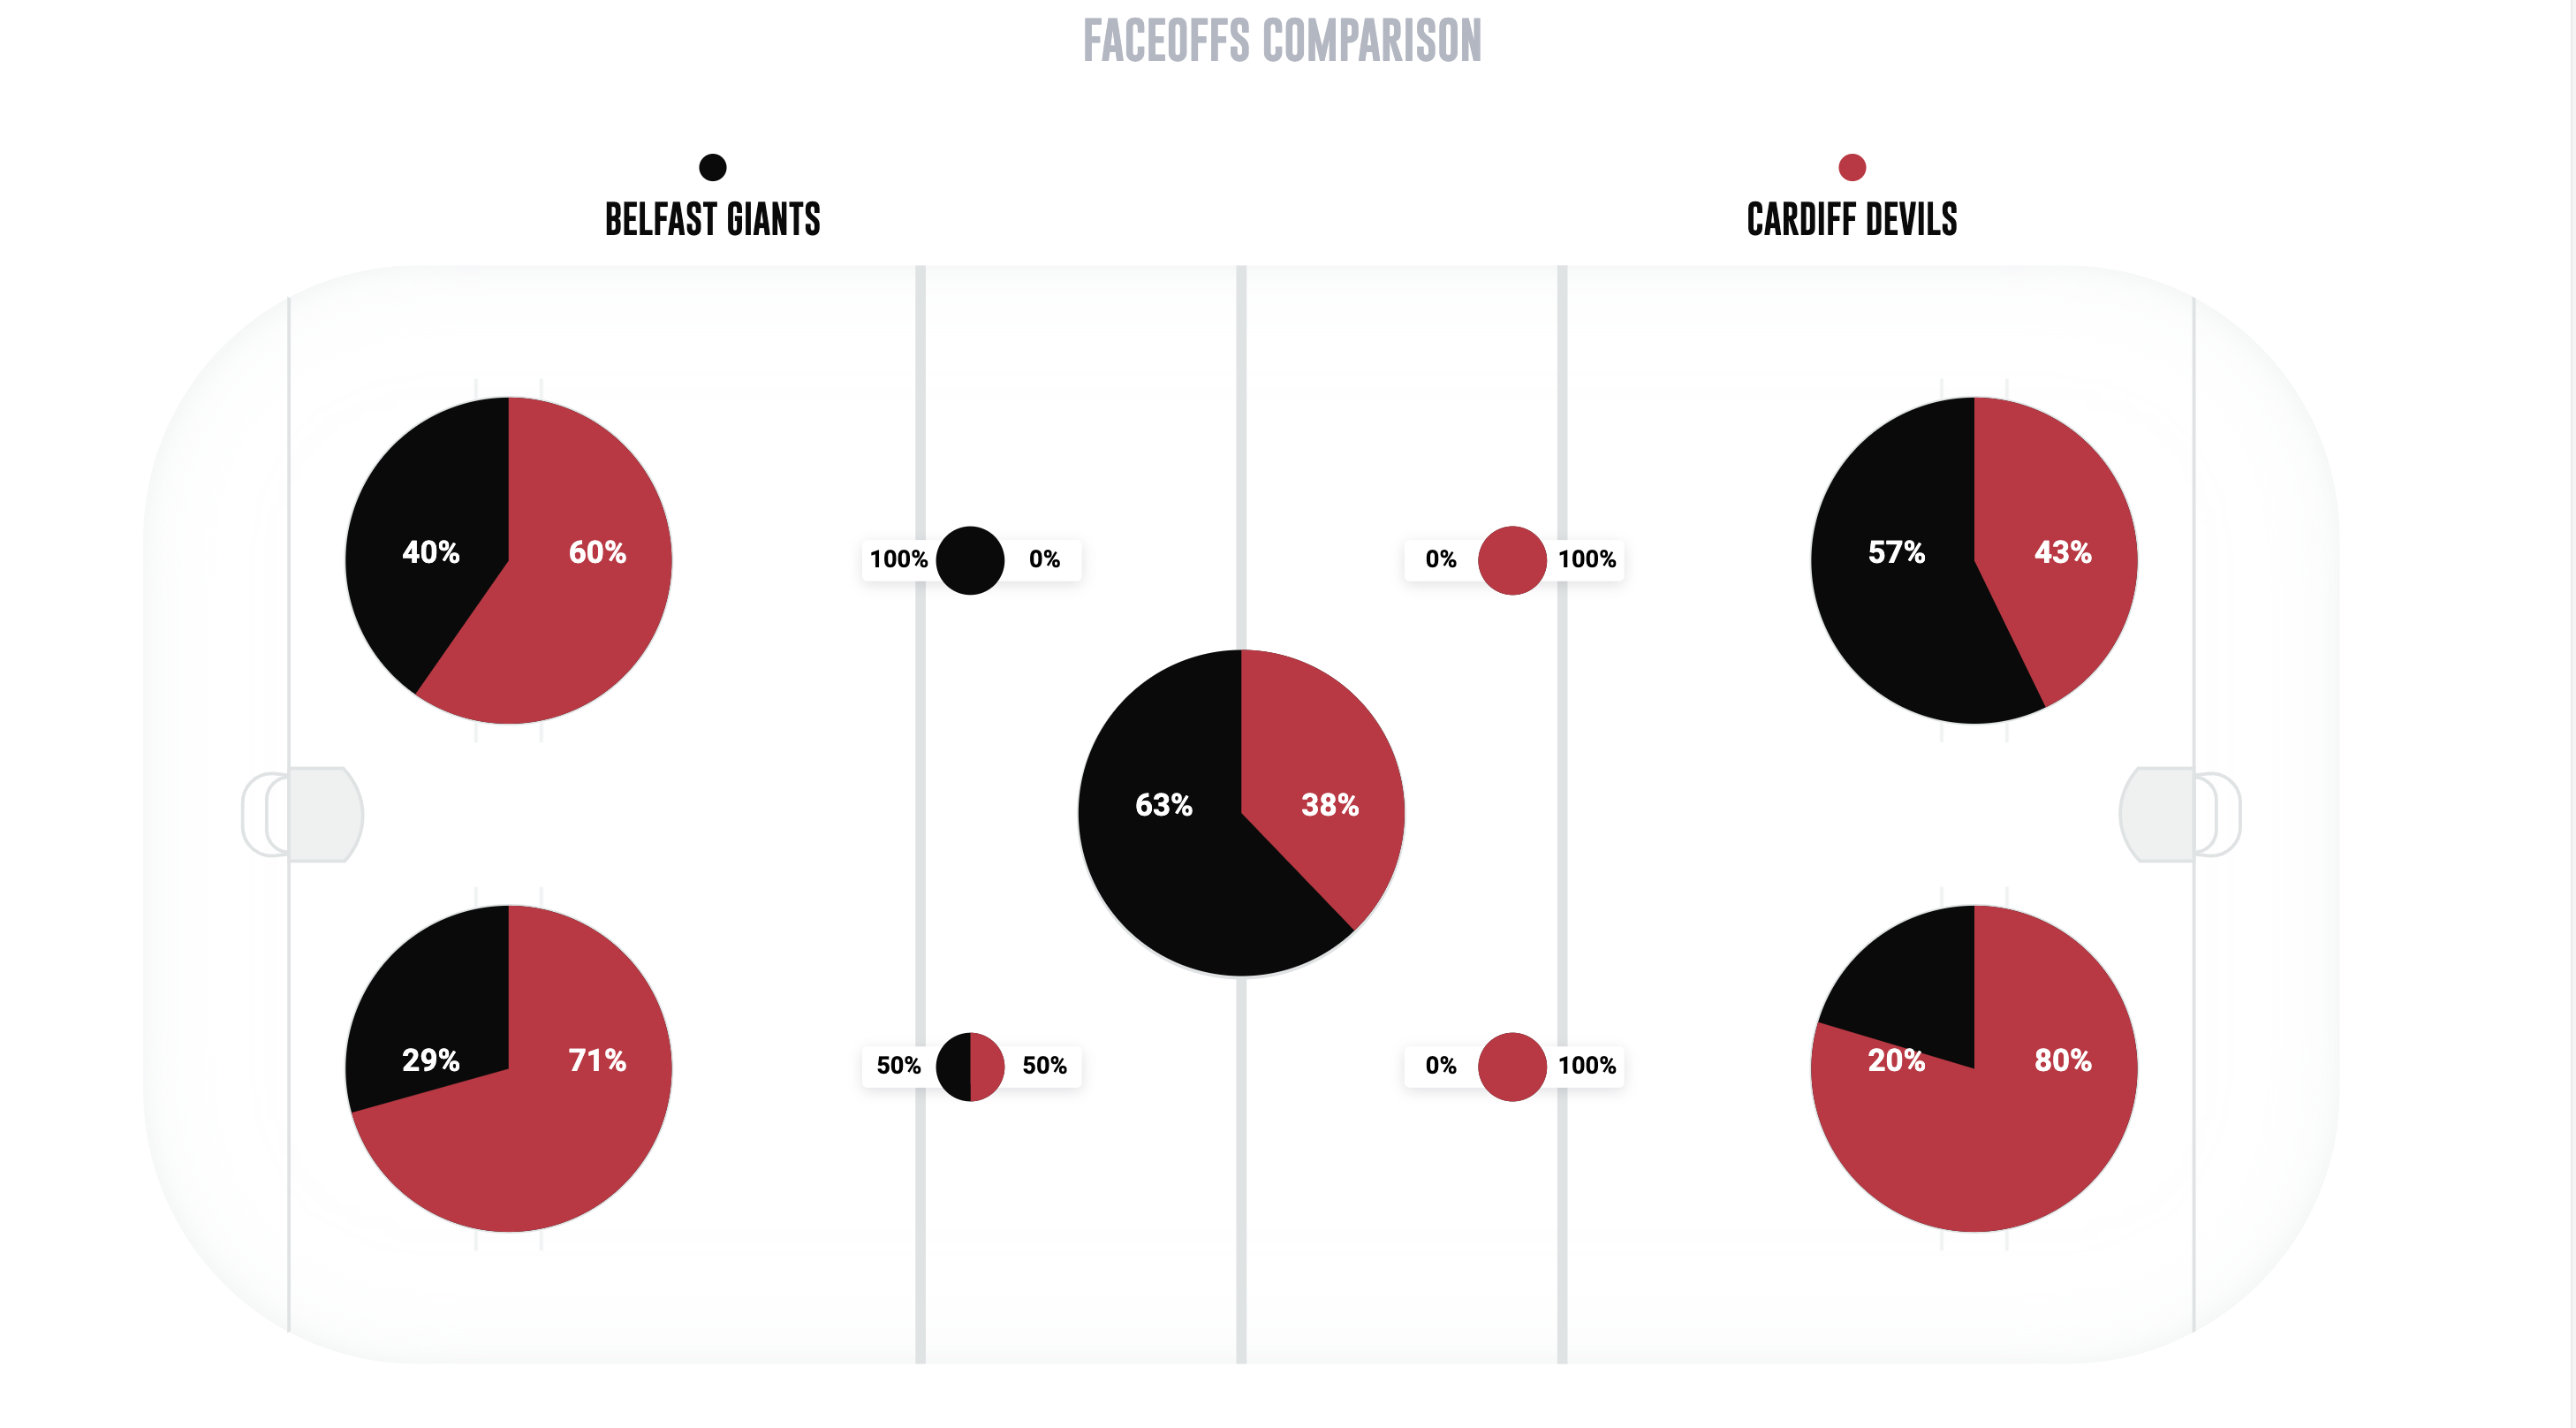
- Updated Faceoff Chart: The faceoff chart now details faceoff win percentage by each faceoff dot on the ice, instead of the previous version which was detailing the same data but by zone only.
Other Updates
- The first part of the Gamecentre, the 'Events' tab, has updated game events included, such as: goalies in/out, timeouts and video review decision details
- Each player will also have a new statistics category allocated to both in-game and overall profiles: Blocked shots. You'll be able to see which players put their bodies on the line the most.
Gallery