Have you checked out our extra statistics?
See the game in more detail!
Introduced to the Elite League for season 2019/20, we now track extra statistics during each game.
For every match in the Elite Series, click the 'Tracking' tab in the gamecentre to see more detail about how each game has played out.
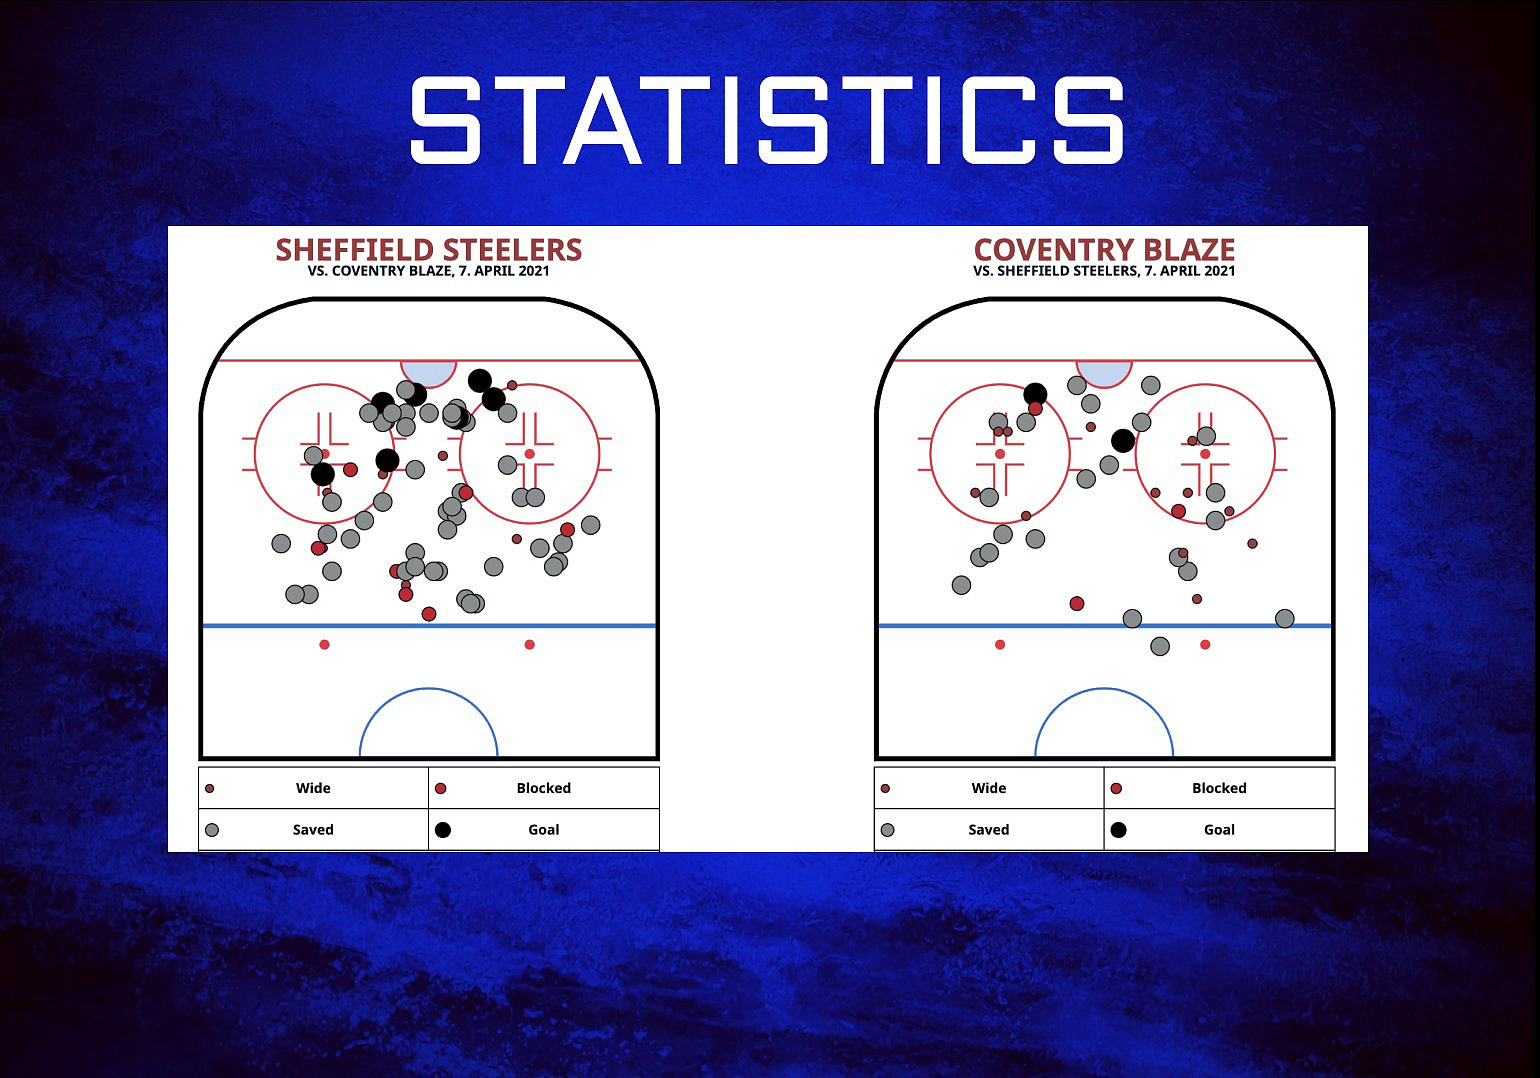
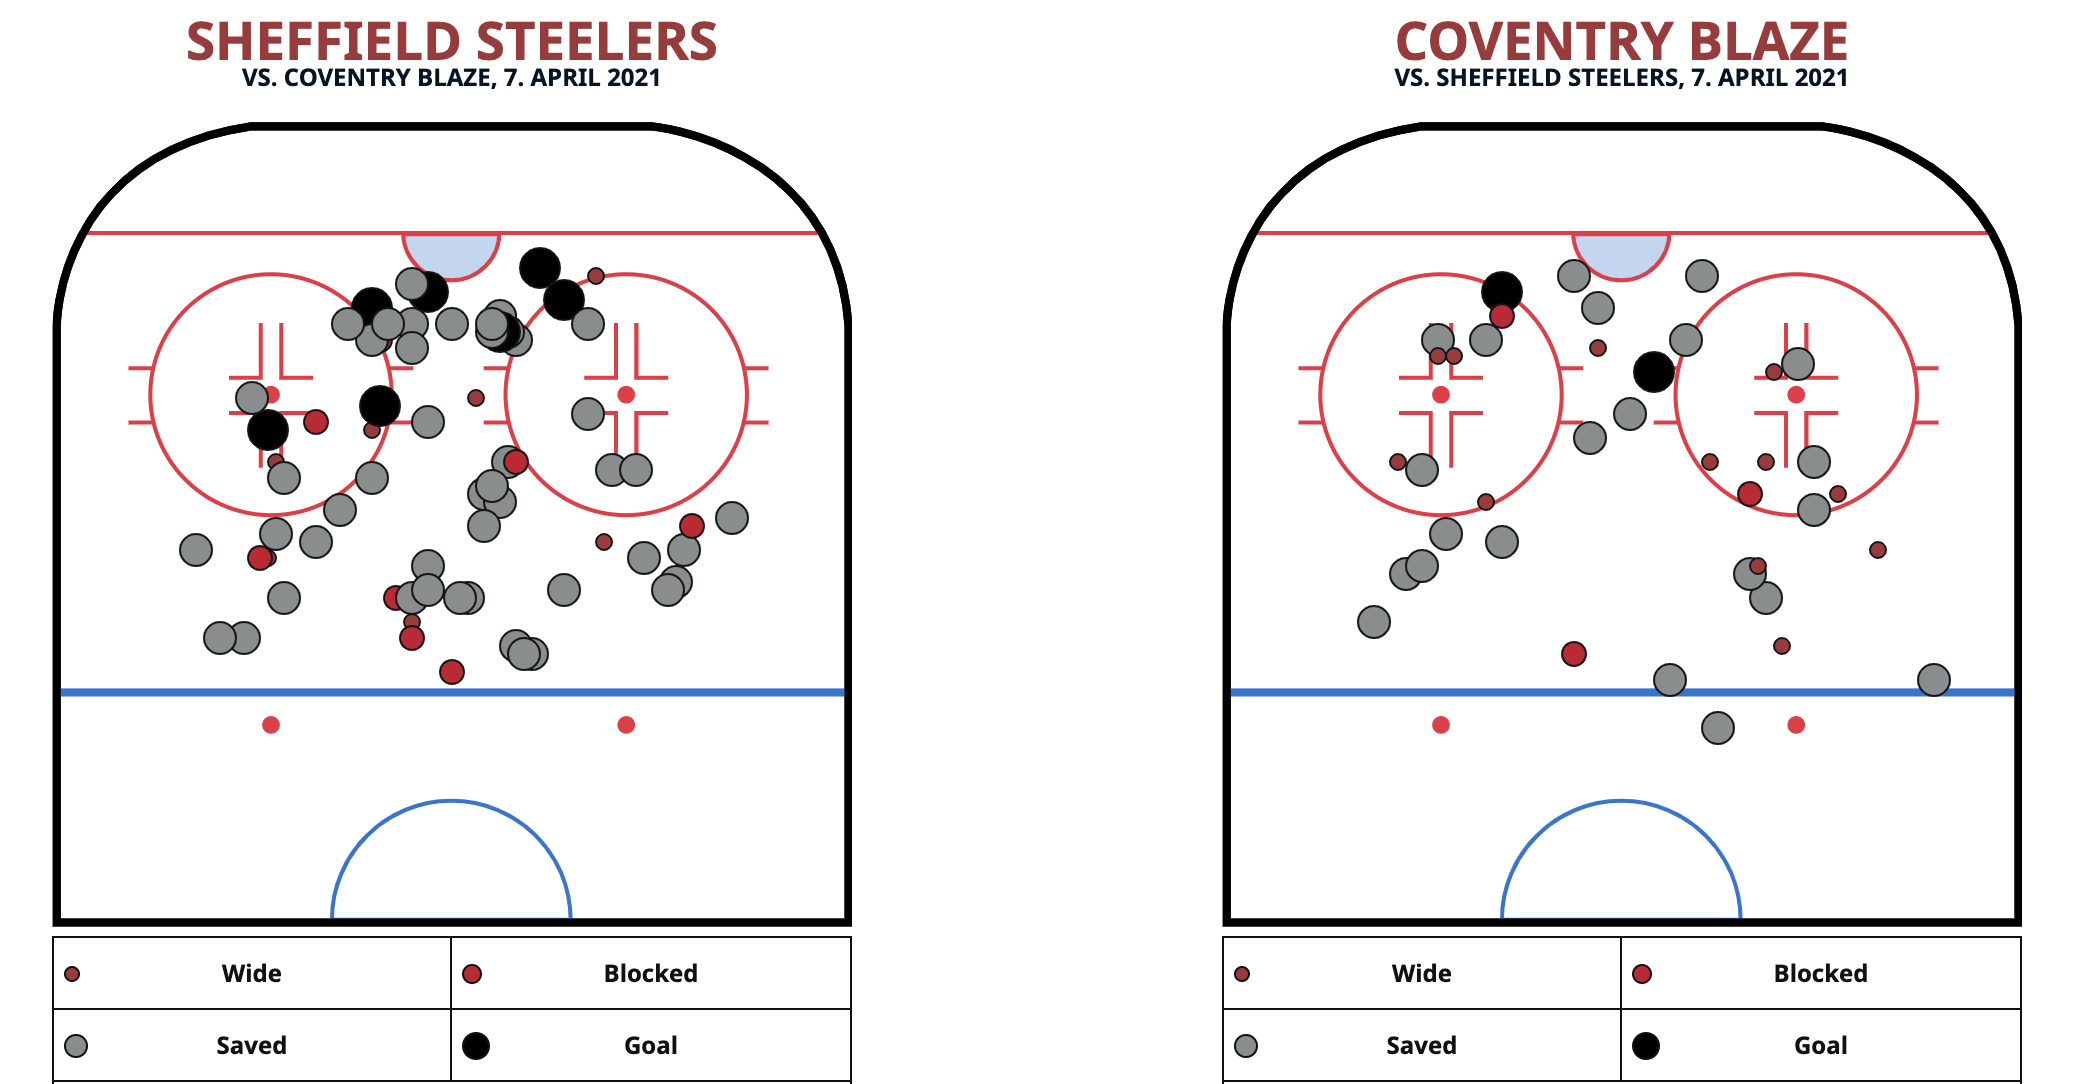
Shot Maps
Who's shooting, from where, and what happened? That's what the shop maps give you for every game, You can also filter by individual players to see where they're most active in the offensive zone.
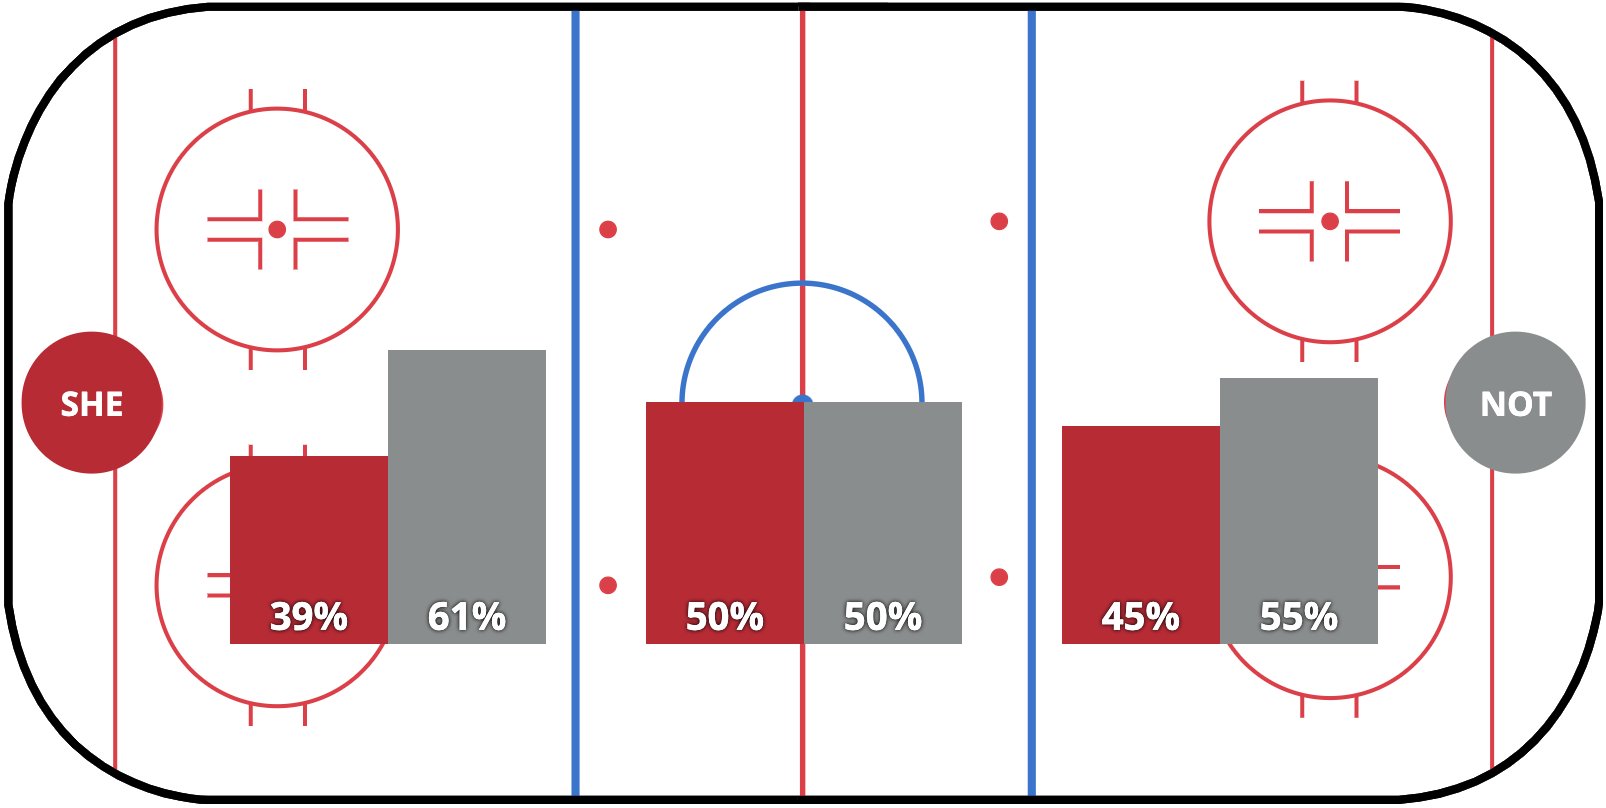
Faceoff Charts
Who's dominating in the dot? Faceoff charts show you how many draws each team in winning in each zone of the ice, while in the Statistics section you can also see which players are leading the series for wins.
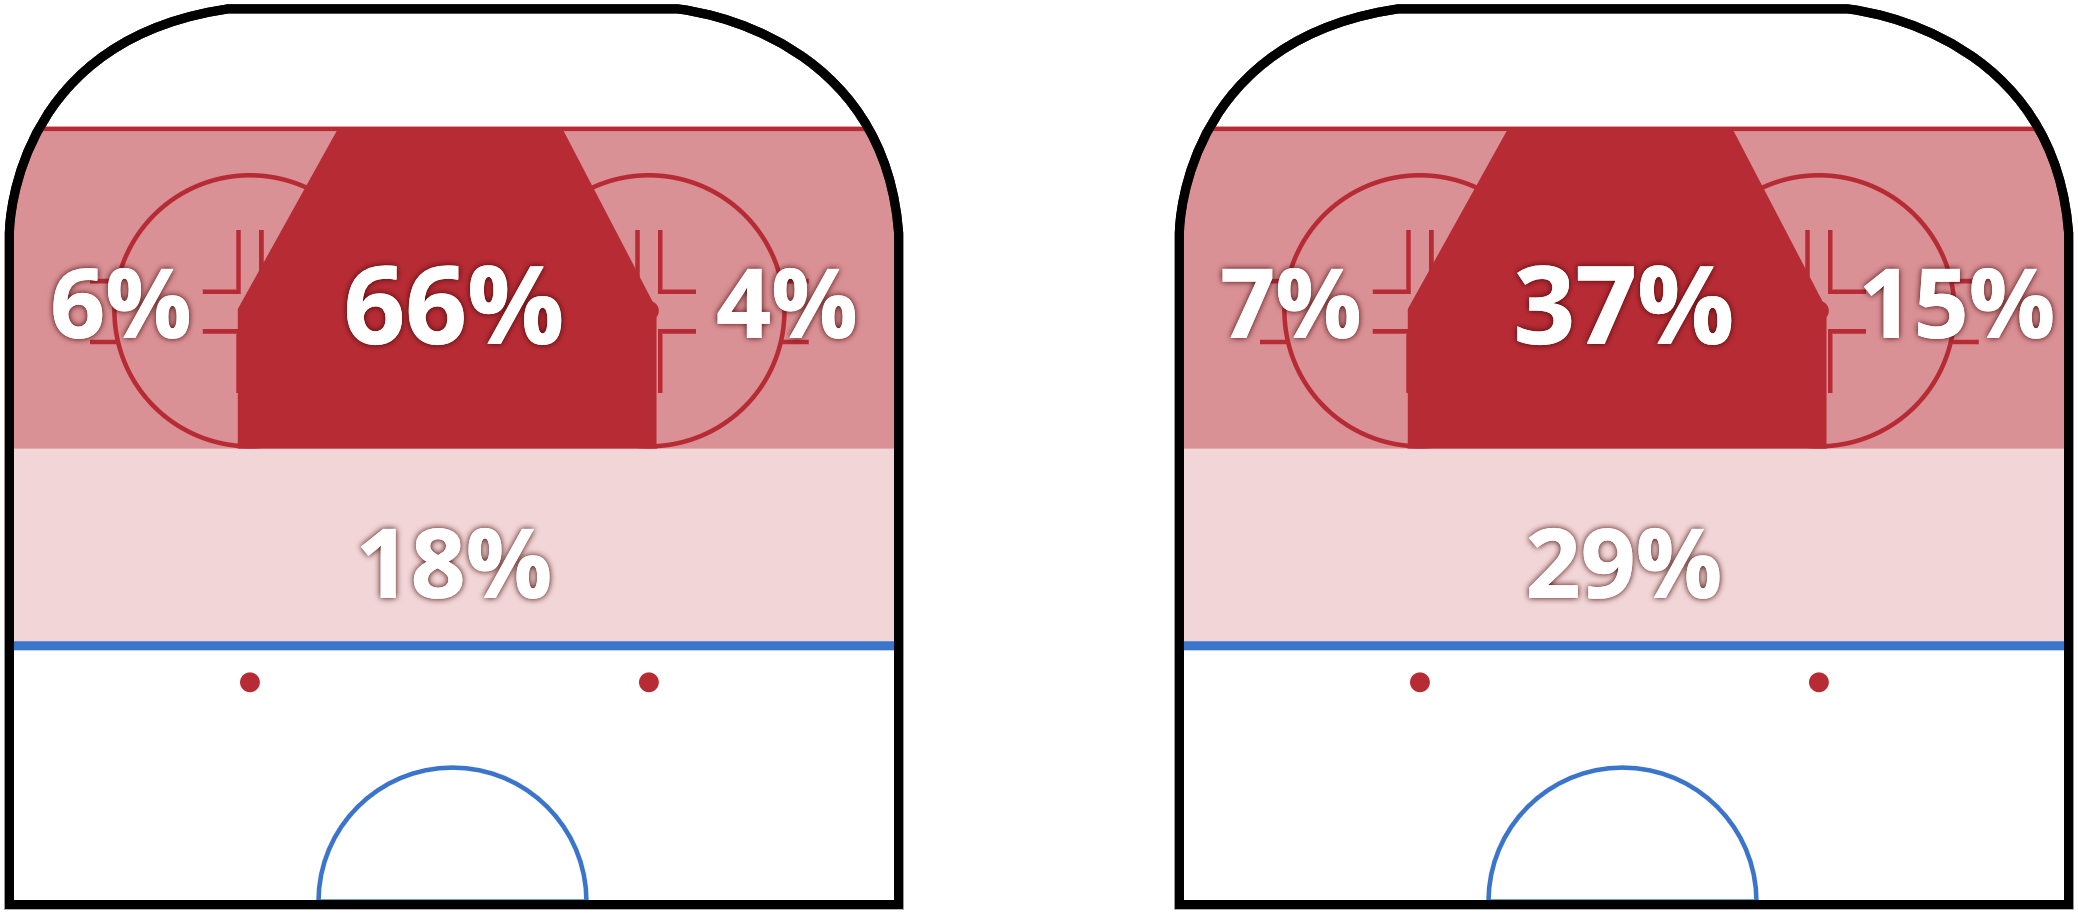
Shot Zones
You often hear coaches and players talk about "keeping them to the outside", and with the shooting zone maps you can see how successful they were at doing that. For example, 66% of the Steelers' shots in their 8-4 win against the Panthers came from the slot!